The Van Westendorp price sensitivity meter is defined as a technique for market researchers to gauge consumer perceptions of the value of products or services. It usually means asking four specific questions to help uncover the best price for the product.
The inventor of this pricing analysis approach was a Dutch economist Peter Van Westendorp. The Van Westendorp survey questions help organizations avoid scaring potential customers away by a large price tag. On the other hand, a low price tag will leave them skeptical of the product’s quality. The goal of the Van Westendorp Price Sensitivity Meter is to maximize the profit that is generated from a certain product or service.
The four standard Van Westendorp questions to measure price sensitivity
To get the most appropriate answers to price out the product or service, you need to first ask the correct questions. The Van Westendorp survey questions are as follows:
Q1. At what price would you consider the product to be too expensive that you would consider not buying it? (Too expensive)
Q2. At what price would you consider the product to be priced too low and because of it you would feel that the quality of the product or service is poor? (Too cheap)
Q3. At what price would you consider the product becoming too expensive – so that it is not out of the question, but you would have to give some thought to buying it? (Expensive/High Side)
Q4. At what price would you consider the product to be a bargain—a great buy for the money? (Cheap/Good Value)
The Van Westendorp Price Sensitivity Meter questions have remained virtually unchanged over the years. and have helped multinationals and small businesses alike to measure price sensitivity and to set up successful pricing strategies. From a bag of Lay’s chips to Apple’s iPhone, Van Westendorp’s price sensitivity measurement surveys have influenced decision-making.
The price sensitivity meter satisfies the question of how to do a pricing analysis and marketers can implement it for both, new, and existing products. You can give the respondent price options for each question type to know whether the price is right or leave it open-ended.
How to use the Van Westendorp Model for pricing research
Organizations tasked with making a profit operate under a strategy that is dependent upon multiple factors including market share; volatility; brand position; and the current state of the economy. The primary goal here is to maximize the profit generated by the firm. Understanding your current (and prospective) markets’ view on pricing is a key driver revenue and profit margin.
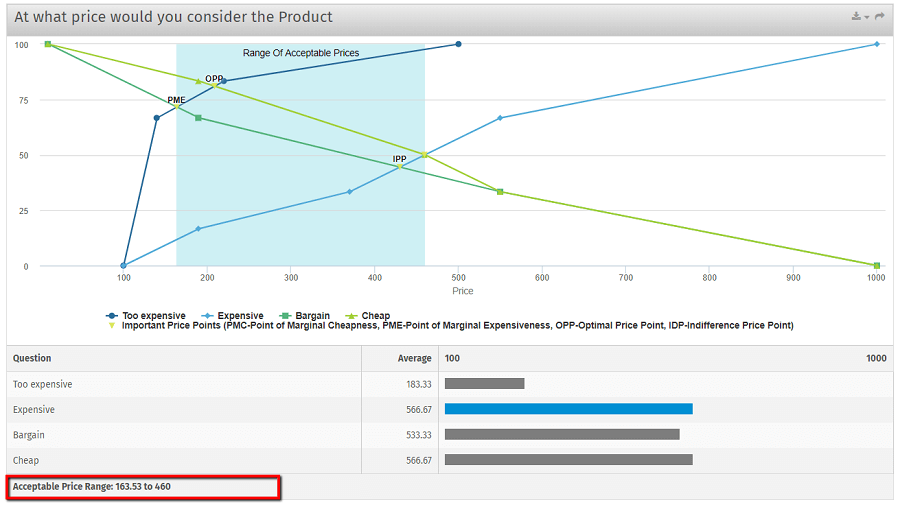
Use the Van Westendorp pricing study to conduct pricing analysis and determine the following price points:
- Point of marginal expensiveness – The price point where cost becomes a major concern, and where customers will generally feel that the price of the product/service outweighs the benefit.
- Point of marginal cheapness – The price point where sales would be negatively impacted due to a customer’s perception of lack of quality versus the value derived from it.
- Optimal price point – The price point where the same percentage of customers feel that the price is too expensive versus the quality of the product or service.
- Indifference price point – The point at which the same percentage of customers feel that the product is getting too expensive as those who feel it is at a bargain price. This is where the most amount of customers are indifferent to the price.
By interpreting the graph above, you should be able to get an accurate estimate of your pricing. Very generally, pricing needs to be between the Point of Marginal Cheapness and the Point of Marginal Expensiveness; this is called the Range of Acceptable Pricing (RAI). With the example above, the Range of Acceptable Pricing is $15 – $30.
Consumers can usually give a realistic idea about price, making this a valuable technique. On the contrary, this assumes that the person you are surveying understands the landscape of the product to an extent. If the respondents are not as familiar with what you are asking them, the survey data will not be as useful in the end.
The model is easy to implement when compared to other pricing research methods. It can be used in support of both new and existing products and services. To be effective the survey researcher should include a description and/or visual of the product/service.
In deploying a Van Westendorp exercise is common to provide the respondent with a pre-established range of prices using 10 – 15 categories for each price estimate. Prices can also be captured in an open response fashion and categorized after the fact.
Extensions to this technique ask supplementary questions regarding purchase likelihood for the “good value” and “expensive” price points. It is also fair to ask the respondent to elaborate on their reasons for selecting their price points. These additions can be useful for translating the survey data into a demand forecast. Here is a pricing study template you can start with to evaluate the right price for your product or service.
Van Westendorp Price Flexibility Example
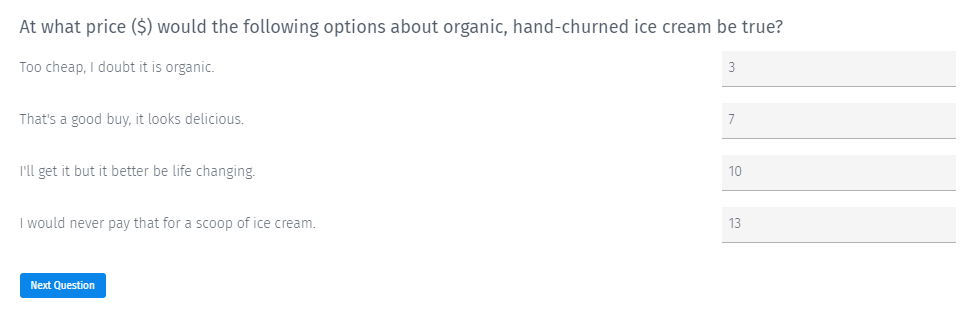
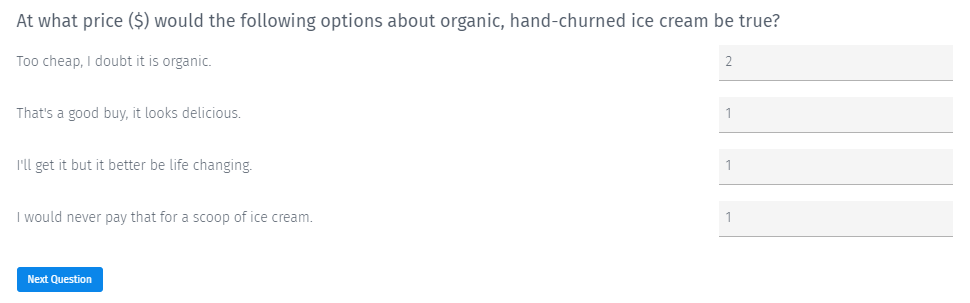
Let’s take, for example, a Van Westendorp question about a boutique ice cream shop that is opening up in San Francisco. This ice cream is organic and hand-churned—it is simply the best of the best. However, before opening, you need to know how much you can charge for a prized single-scoop of ice cream. The best way to know how much your customers are willing to pay is to simply ask.
The example of the Van Westendorp pricing study clearly illustrates how respondents feel about ice cream. This could become inaccurate if someone who filled it out did not partake in ice cream eating—perhaps due to their lactose intolerance. In that case, their survey answer may look drastically different.
If that is the case, your data may potentially become flawed, which is why Van Westendorp price sensitivity meter should be used to provide input into how you price your product, rather than be the finite answer.
Once responses are collected, the ideal price becomes very clear. As shown in the graph below, the red line represents “Too Cheap,” a price where the customer becomes skeptical of the product quality. The purple line, which is indicative of “Not a Bargain,” represents the customers that found the product on the high side but would still consider buying. The purple, or “Not a Bargain” line, intersects with the “Too Cheap” line at about $3.75.
That intersection of price points is the Point of Marginal Cheapness, representing the price where the majority of sales are lost due to the customer perception’s lack of product quality. The Point of Marginal Expensiveness is where the price becomes a major concern based on its costly nature. That point is represented where the blue, “Too Expensive” line intersects with the green, “Not Expensive” line. For the organic ice cream, the Point of Marginal Expense is about $5.90. The range of acceptable prices is spread between the Point of Marginal Cheapness and the Point of Marginal Expense. For the organic, hand-churned ice cream, the data suggests setting a price between $3.75 and $5.90.
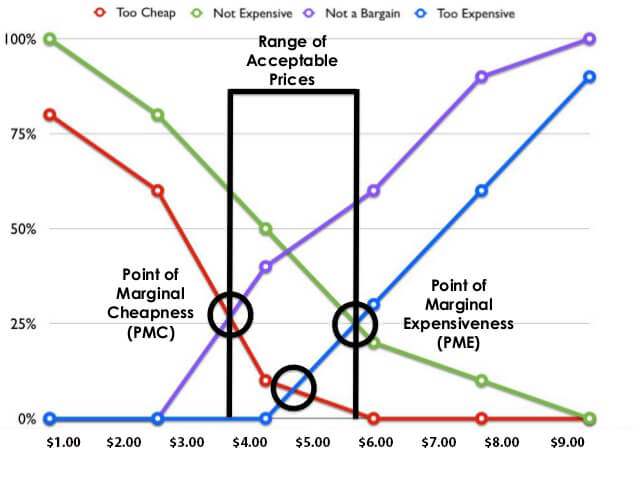
The Indifference Price Point and Optimal Price Point helps with delineating the best price within your range of acceptable prices. Indifference Price Point is where the “Not Expensive” and “Not a Bargain” lines bisect each other. This is defined as the point at which the percentage of customers that feel it is a bargain price and customers that feel it is too expensive are equal. Optimal Price Point, on the other hand is when the same percentage of customers feel that the price is too expensive versus the quality of the product or service, where the “Too Cheap” and “Too Expensive” lines intersect. These two points allow businesses to make educated pricing decision, so they fall within the “Range of Acceptable Prices,” which you can see in the graph.
In conclusion, you can better understand the scope of your pricing by using the Van Westendorp price sensitivity meter. This data helps business owners and decision makers choose the right price that will neither scare off potential consumers nor lead them to believe you are offering a low-quality product. By harnessing your most recently gained insight of customer pricing, you can appeal to a wider audience.
Learn more: Van Westendorp – Price Sensitivity Question Type
Example: Van Westendorp survey template for the Van Westendorp price sensitivity model.