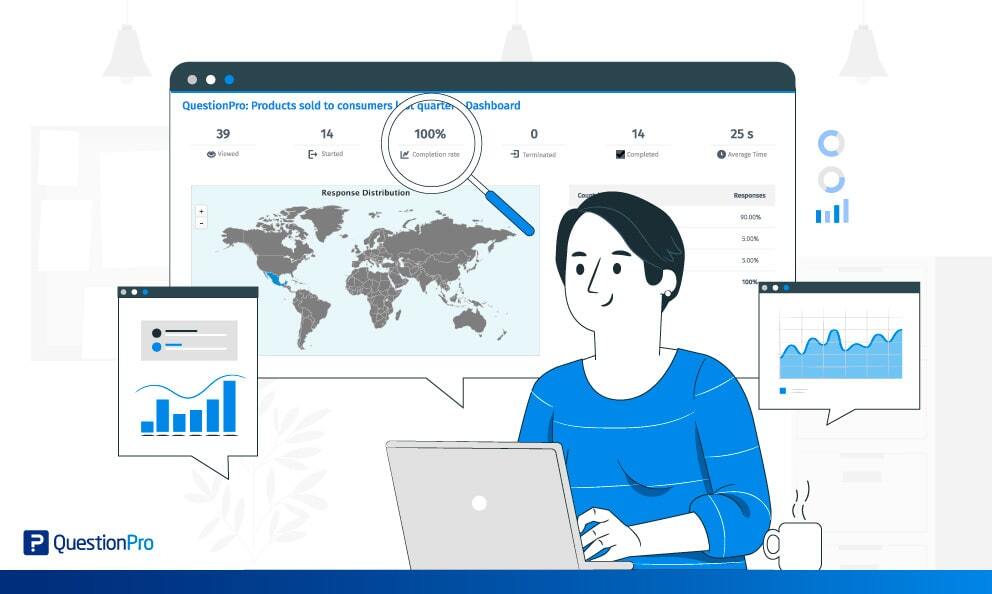
Nowadays, data is collected at various stages of processes and transactions, which has the potential to significantly improve the way we work. However, to fully realize value of data analysis, this data must be analyzed in order to gain valuable insights into improving products and services.
Data analysis is a crucial aspect of making informed decisions in various industries. With the advancement of technology, it has become a dynamic and exciting field But what is it in simple words?
What is Data Analysis?
Data analysis is the science of examining data to conclude the information to make decisions or expand knowledge on various subjects. It consists of subjecting data to operations. This process happens to obtain precise conclusions to help us achieve our goals, such as operations that cannot be previously defined since data collection may reveal specific difficulties.
“A lot of this [data analysis] will help humans work smarter and faster because we have data on everything that happens”. –Daniel Burrus, business consultant and speaker on business and innovation issues.
Types of Data Analysis
There are several types of data analysis, each with a specific purpose and method. Let’s talk about some significant types:
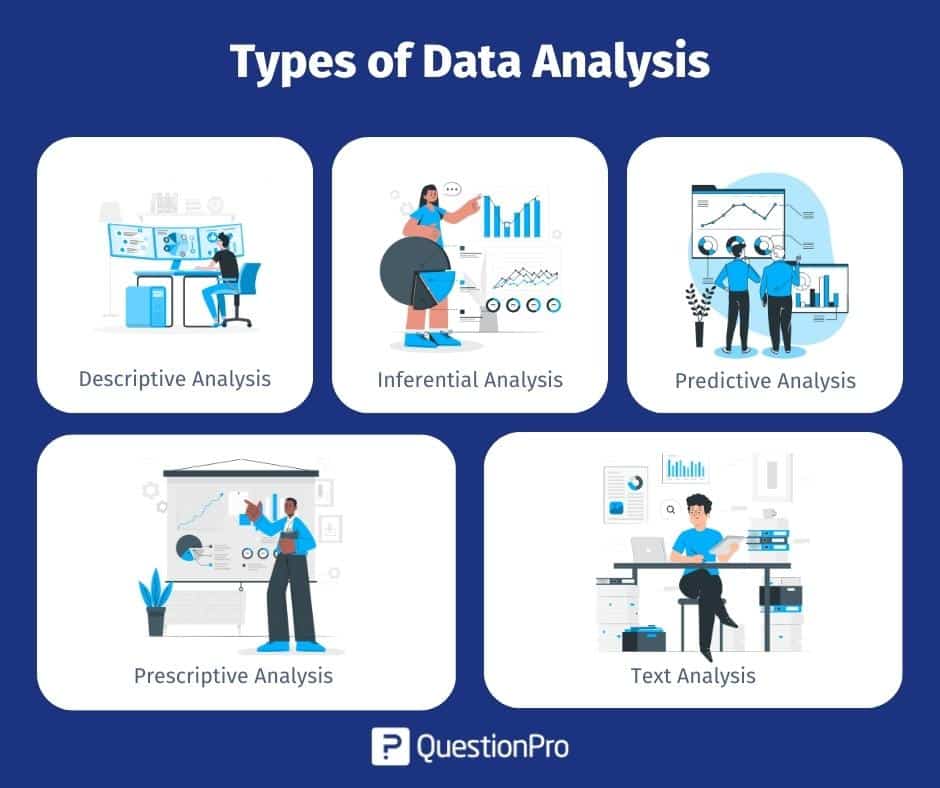
Descriptive Analysis
Descriptive analysis is used to summarize and describe the main features of a dataset. It involves calculating measures of central tendency and dispersion to describe the data. The descriptive analysis provides a comprehensive overview of the data and insights into its properties and structure.
Inferential Analysis
The inferential analysis is used statistical models and testing to make inferences about the population parameters, such as the mean or proportion. This unit of analysis involves using models and hypothesis testing to make predictions and draw conclusions about the population.
Predictive Analysis
Predictive analysis is used to predict future events or outcomes based on historical data and other relevant information. It involves using statistical models and machine learning algorithms to identify patterns in the data and make predictions about future outcomes.
Prescriptive Analysis
The prescriptive analysis is a decision-making analysis that uses mathematical modeling, optimization algorithms, and other data-driven techniques to identify the action for a given problem or situation. It combines mathematical models, data, and business constraints to find the best move or decision.
Text Analysis
Text analysis is a process of extracting meaningful information from unstructured text data. It involves a variety of techniques, including natural language processing (NLP), text mining, sentiment analysis, and topic modeling, to uncover insights and patterns in the text data.
Data Analysis Advantages
Currently, many industries use data to draw conclusions and decide on actions to implement. It is worth mentioning that science also uses to test or discard existing theories or models.
There’s more than one advantage to data analysis done right. Here are some examples:
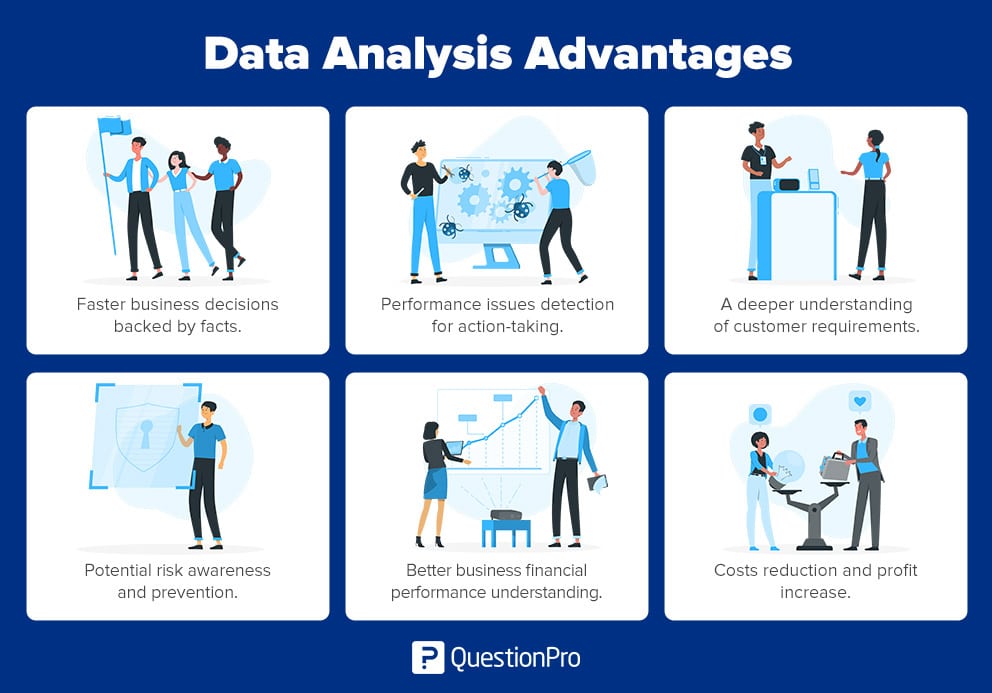
- Make faster and more informed business decisions backed by facts.
- Identify performance issues that require action.
- Gain a deeper understanding of customer requirements, which creates better business relationships.
- Increase awareness of risks to implement preventive measures.
- Visualize different dimensions of the data.
- Gain competitive advantage.
- Better understand the financial performance of the business.
- Identify ways to reduce costs and thus increase profits.
These questions are examples of different types of data analysis. You can include them in your post-event surveys aimed at your customers:
- Qualitative research analysis focuses on opinions, attitudes, and beliefs.
- Questions start with: Why? How?
Example of qualitative data research analysis: Panels where a discussion is held, and consumers are interviewed about what they like or dislike about the place.
- Quantitative research analysis focuses on complex data and information that can be counted.
- Data is collected by asking questions like: How many? Who? How often? Where?
Example of quantitative research analysis: Surveys focused on measuring sales, trends, reports, or perceptions.
Uses of Data Analysis
It is used in many industries regardless of the branch. It gives us the basis to make decisions or confirm if a hypothesis is true.
- Marketing: Mainly, researchers perform data analysis to predict consumer behavior and help companies place their products and services in the market accordingly. For instance, sales data analysis can help you identify the product range not-so-popular in a specific demographic group. It can give you insights into tweaking your current marketing campaign to better connect with the target audience and address their needs.
- Human Resources: Organizations can use data analysis to offer a great experience to their employees and ensure an excellent work environment. They can also utilize the data to find out the best resources whose skill set matches the organizational goals.
- Academics: Universities and academic institutions can perform the analysis to measure student performance and gather insights on how certain behaviors can further improve education.
Techniques for Analysis
IT is essential to analyze raw data to understand it. We must resort to various techniques that depend on the type of information collected, so it is crucial to define the method before implementing it.
- Qualitative data: Researchers collect qualitative data from the underlying emotions, body language, and expressions. Its foundation is the data interpretation of verbal responses. The most common ways of obtaining this information are through open-ended interviews, focus groups, and observation groups, where researchers generally analyze patterns in observations throughout the data collection phase.
- Quantitative data: Quantitative data presents itself in numerical form. It focuses on tangible results.
Data analysis focuses on reaching a conclusion based solely on the researcher’s current knowledge. How you collect your data should relate to how you plan to analyze and use it. You also need to collect accurate and trustworthy information.
There are many data collection techniques, but experts’ most commonly used method is online surveys. It offers significant benefits such as reducing time and money compared to traditional data collection methods. The
At QuestionPro, we have an accurate tool that will help you professionally make better decisions.
Step-by-Step Guide Data Analysis
With these five steps in your process, you will make better decisions for your business because data that has been well collected and analyzed support your choices.
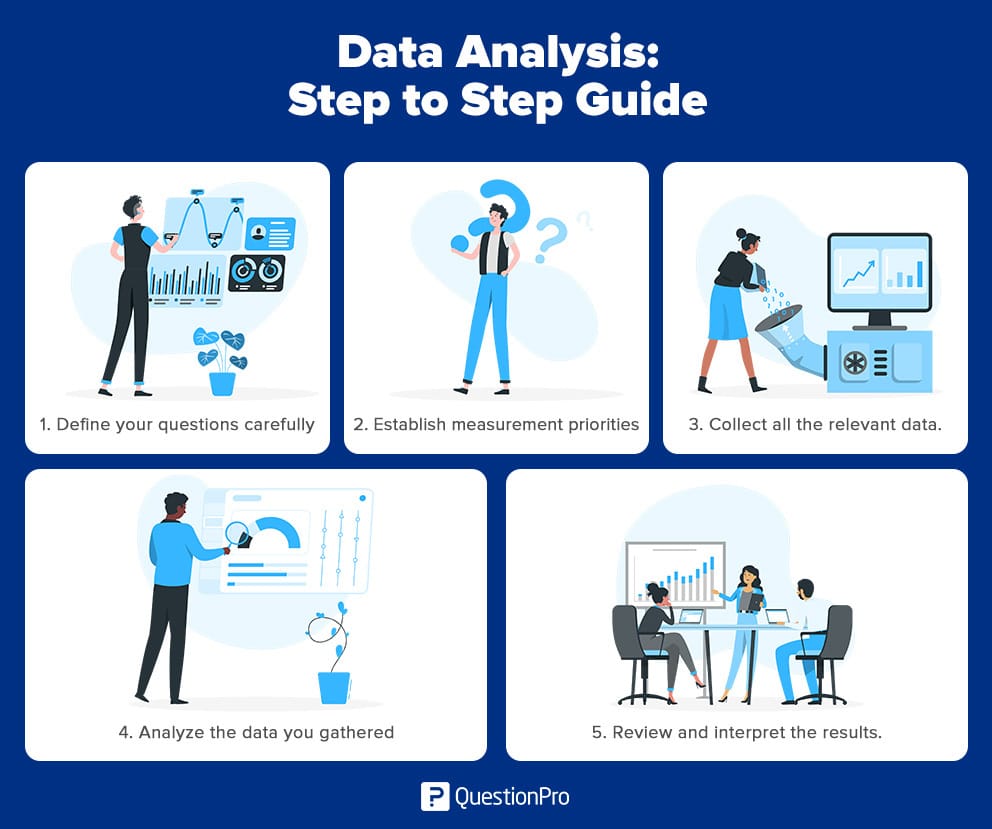
Step 1: Define your questions
Start by selecting the right questions. Questions should be measurable, clear, and concise. Design your questions to qualify or disqualify possible solutions to your specific problem.
Step 2: Establish measurement priorities
This step divides into two sub-steps:
- Decide what to measure: Analyze what kind of data you need.
- Decide how to measure it: Thinking about how to measure your data is just as important, especially before the data collection phase, because your measurement process supports or discredits your thematic analysis later on.
Step 3: Collect data
With the question clearly defined and your measurement priorities established, now it’s time to collect your data. As you manage and organize your data, remember to keep these essential points in mind:
- Before collecting new data, determine what information you could gather from existing databases or sources.
- Determine a storage and file naming system to help all team members collaborate in advance. This process saves time and prevents team members from collecting the same information twice.
- If you need to collect data through surveys, observation, or interviews, develop a questionnaire in advance to ensure consistency and save time.
- Keep the collected data organized with a log of collection dates, and add any source notes as you go along.
Step 4: Analyze the data
Once you’ve collected the correct data to answer your Step 1 question, it’s time to conduct a deeper statistical analysis. Find relationships, identify trends, sort and filter your data according to variables. As you analyze the data, you will find the exact data you need.
Step 5: Interpret the results
After analyzing the data and possibly conducting further research, it is finally time to interpret the results. Ask yourself these key questions:
- Does the data answer your original question? How?
- Does the data help you defend any objections? How?
- Are there any limitations to the conclusions, any angles you haven’t considered?
If the interpretation of data holds up under these questions and considerations, you have reached a productive conclusion. The only remaining step is to use the results of the process to decide how you are going to act.
Join us as we look into the most frequently used question types, and how to effectively analyze your findings.
Make the right decisions by analyzing data the right way!
Data Analysis with QuestionPro
Data analysis is crucial in aiding organizations and individuals in making informed decisions by comprehensively understanding the data. If you’re in need of a data analysis solution, consider using QuestionPro. Our software allows you to collect data easily, create real-time reports, and analyze data.
Start a free trial or schedule a demo to see the full potential of our powerful tool. We’re here to help you every step of the way!