The NPS score is used to classify customers and help businesses improve their experience.
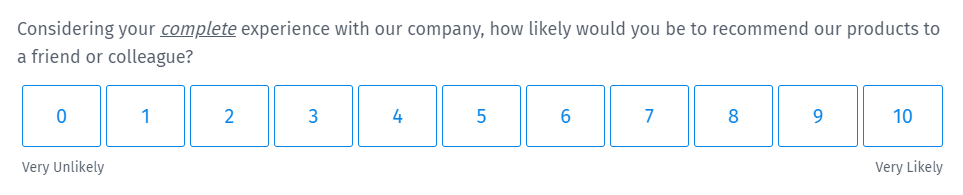
Net Promoter Score NPS survey question
Typical NPS surveys consist of just one question.
Considering your complete experience with our company, how likely would you be to recommend us to your friend or colleague?
The answer options are arranged horizontally on a scale of 0-10.

Based on the score, the customers fall into one of the 3 categories.
Promoters: Customers who rate 9 or 10 and are happy with your services. They are loyal enthusiasts and might prove to be evangelists for your business. They are extremely likely to recommend your company to people in their social or professional circles.
Passives: Customers who rate 7 or 8 and have average experience with your company. They are satisfied with your services but might switch your competitors if given an opportunity. They have a neutral stand - won't spread negative word-of-mouth but won't promote your brand either.
Detractor: Customers who rate below 6 and are not happy with your products or services. They share their bad experiences with others and damage company's reputation. They would not like to repurchase your products or services and would discourage others too.
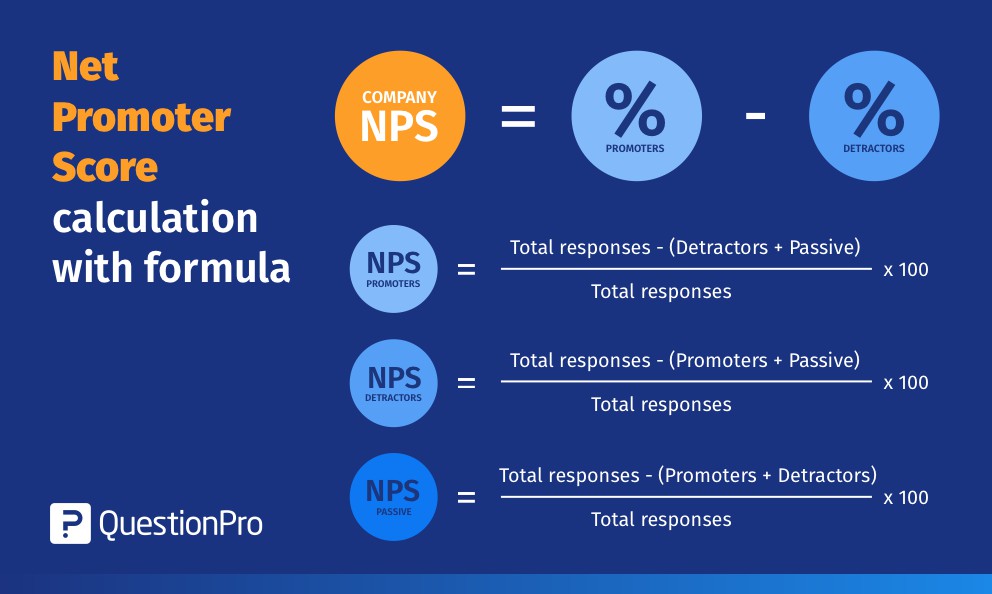
Net Promoter Score calculation with formula
You can calculate NPS by subtracting the percentage of detractors from the percentage of promoters.
To calculate the number of promoters, subtract the count of passives and detractors from the total respondents.
Explore: What is a good Net Promoter Score?
Example of a Net Promoter Score question
Consider a coffeehouse that wants to calculate the Net Promoter Score of its store. The results will give them insights into customer experience and how likely their customers are to refer their coffee shop to others.
Assuming they asked NPS questions to their 100 customers, 40 rated their products and services 9, 20 rated 10, 20 rated 7, 10 rated 8, and 10 customers rated 6 or below.
So, the categorization of the customers is as below.
Promoters = 40 + 20 (Rating 9 and above)
Passives = 20 + 20 (Rating 7-8)
Detractors = 10 (Rating 6 and below)
The coffeehouse company can use the NPS score to connect with the passives and detractors to learn more about their concerns. They can work on the improvement areas and make sure their customers have a great experience. Customer feedback will help them prioritize resources and gain insights into what matters most to them.
Let's say the passive and detractors customers feel that the store needs to have better lighting and chairs. Thus, these data points are driving the NPS score.
A key driver analysis will help the coffeehouse understand their target audience better and what approach they should take for different segments of customers.
Types of Net Promoter Score questions
Depending on the depth of insights to be collected, NPS questions are categorized into 2 types.
Basic NPS question: Respondents are asked to rate on a scale of 0-10. NPS surveys with this question types consist of one question only.
NPS plus question: NPS plus question type is a combination of NPS, root cause, and comments. It lets respondents share the reasons behind their rating and give detailed feedback via the comments box.
Uses of a Net Promoter Score survey question
In addition to calculating an overall NPS for your organization, you can use an NPS question to get ratings for products or services, website, store, or customer support.
While NPS surveys are typically conducted for customers, you can use the NPS question survey for employees too. The resultant score is known as employee NPS (eNPS). eNPS measures the likelihood of your employees referring your workplace to their friends. It is an indicator of employee health and feedback on the overall work environment.
Improve CX: Without an NPS survey, it would be challenging to have a clear idea of how many of your customers are promoters, passives, and detractors. NPS question makes it easy to find out if you need to improve the overall customer experience. More often than not, poor customer service is responsible for low customer satisfaction, customer loyalty, and a high percentage of detractors. Include open ended questions in your surveys to gather detailed feedback and share it with your front line representatives. This will help them resolve customer queries better.
Close the feedback loop: You can combine the NPS question with an open-ended text question to let respondents share their detailed feedback. They can let businesses know more about their expectations and improvement areas.
Forecast sales: A good NPS score also implies that your current customers are likely to buy your products in the future as well. It enables you to forecast future sales and plan your actions accordingly.
Create sales and marketing strategy: You can upsell or cross-sell your products and services to promoters. At times, educating detractors about the right products and services for them might improve their experience. A proper marketing campaign can showcase the right solutions for the right audience. As customers get segregated into different categories, marketers can create targeted campaigns for each set of people.
Advantages of NPS survey question
Simple to use and respond: NPS question is easy to use for market researchers. You need to drag and drop the question type in an online survey software to create an NPS survey. Respondents have to click on one of the answer options to submit their responses. It doesn't take much time to share their feedback.
Grow business: Responses to the NPS question gives insights on how you can improve customer experience and increase customer satisfaction. Happy customers are highly likely to be your brand ambassadors and promote your business without spending any paid resources.
Retain existing customers: It is economical to retain existing customers than gain a new customer. NPS survey question helps you identify unhappy customers. Working on their feedback will ensure they continue buying your products or services.
Compare with industry benchmarks: Know how you stand in the target market and compare your NPS score with the industry leaders. A comparative analysis will help you know the gaps and by what measure you need to improve.
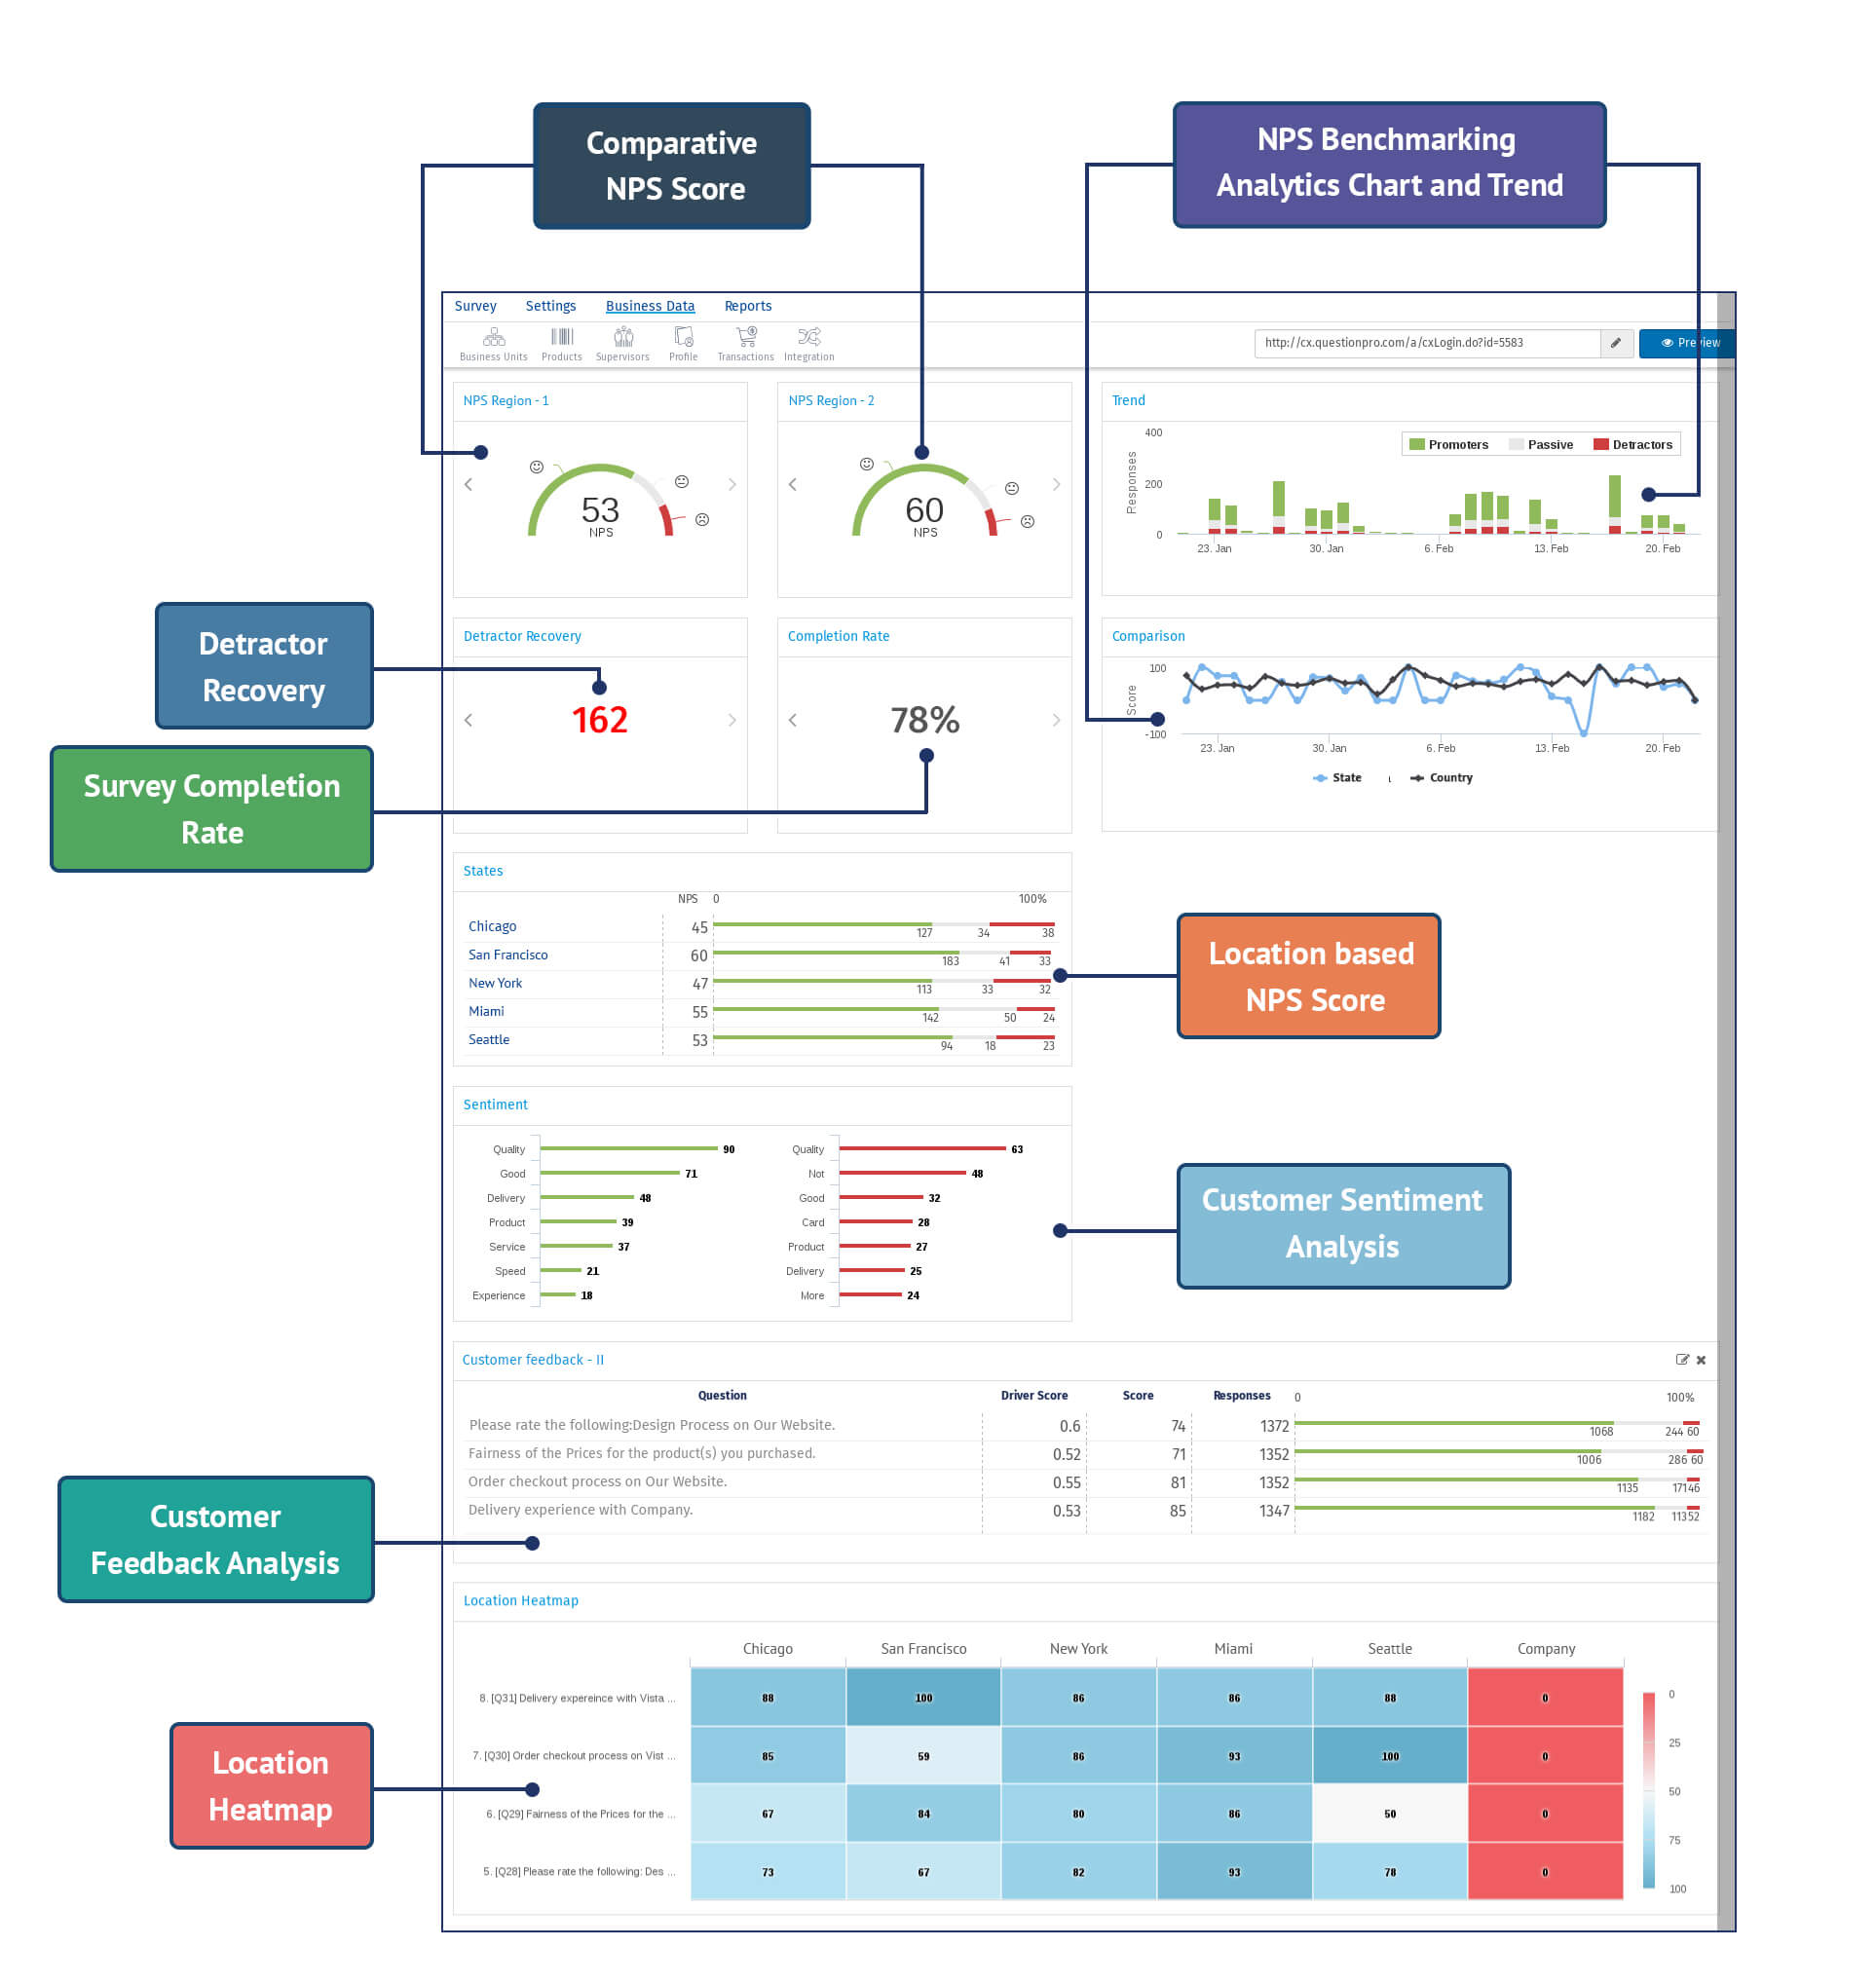
Net Promoter Score (NPS) survey dashboard and comparative NPS survey analysis
One of the critical goals of NPS measurement is to measure how it varies over time. It requires a graphical analysis of the data collected using the NPS survey, with time as a variable.
QuestionPro NPS survey dashboard offers detailed NPS value charts and graphs. It also shows comparative NPS scores and benchmarks based on geographical regions, products, and services.
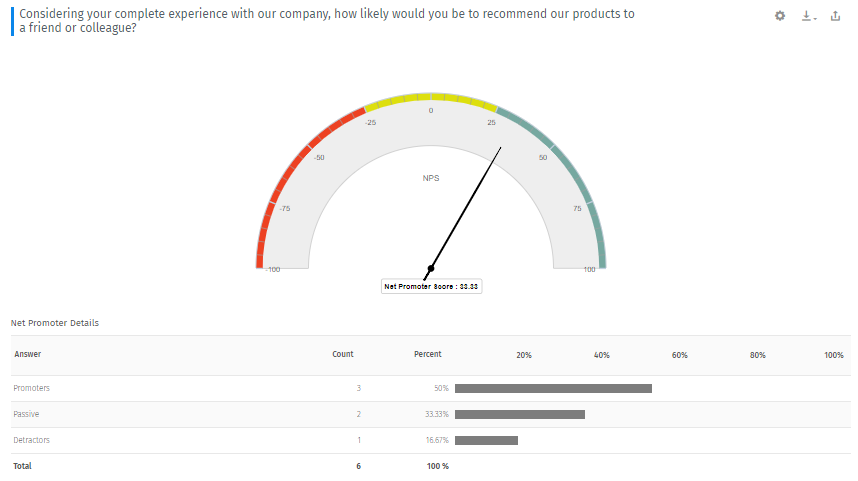
Net Promoter Score (NPS) Survey Meter
QuestionPro Net Promoter Score (NPS) Meter offers a visual representation of the number of promoters, passives, and detractors in real-time. You can also export results in .xls format, apply data filters, and share the NPS report.
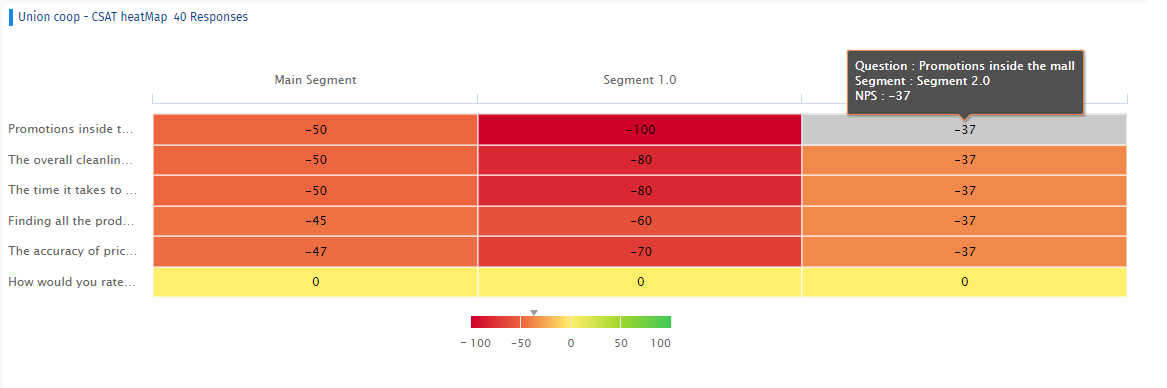
Heatmap will give you a system generated comparative NPS scores of various touchpoints under consideration.
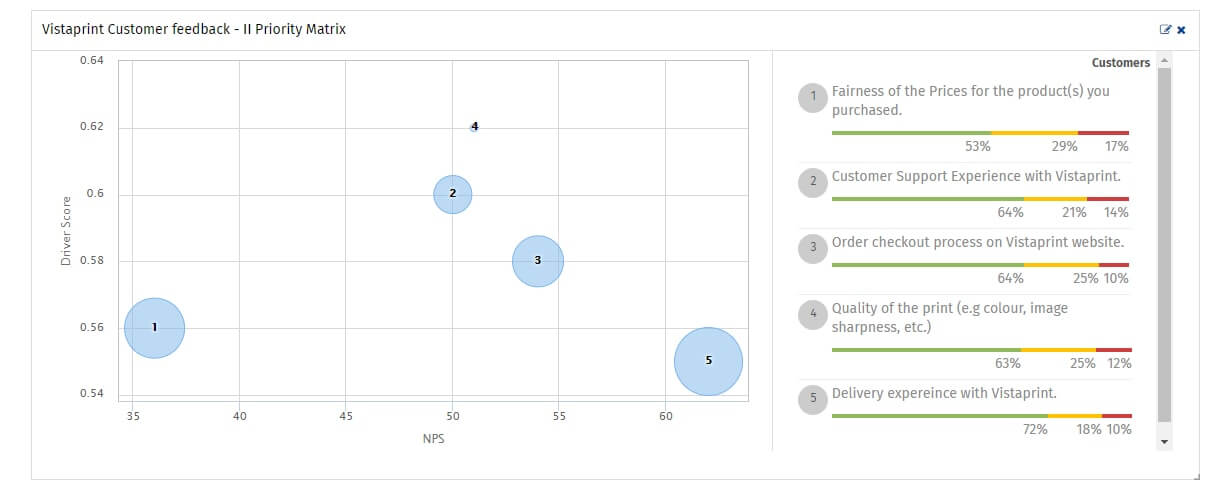
Priority Matrix for Net Promoter Score (NPS) survey will give you insights on the NPS Driver score. High Driver score and Low NPS score represent high priority action items. High Driver score and High NPS score indicate that the touchpoint is stable and driving the business smoothly.
How to use a Net Promoter Score (NPS) question in your surveys?
Learn how to set up and use this feature with our help file on Net Promoter Score question type.
 Survey Software
Easy to use and accessible for everyone. Design, send and analyze online surveys.
Survey Software
Easy to use and accessible for everyone. Design, send and analyze online surveys.
 Research Suite
A suite of enterprise-grade research tools for market research professionals.
Research Suite
A suite of enterprise-grade research tools for market research professionals.
 CX
Experiences change the world. Deliver the best with our CX management software.
CX
Experiences change the world. Deliver the best with our CX management software.
 Workforce
Create the best employee experience and act on real-time data from end to end.
Workforce
Create the best employee experience and act on real-time data from end to end.